TradingView is one of the most popular platforms among traders all over the world. It provides a powerful set of tools for analyzing financial markets, creating trading strategies and communicating with a community of like-minded traders. Today, we will go into detail on how to get started with TradingView, what features it offers and how to effectively use this platform for trading.
Basic information about TradingView
TradingView is a cloud-based platform for traders and investors that allows you to perform technical analysis of financial markets right in your browser. It covers a wide range of assets: stocks, cryptocurrencies, futures, indices and more. The key advantage of TradingView is its ease of use, rich functionality and extensive user community.
Social Media:
https://www.facebook.com/tradingview/
https://x.com/tradingview/
https://www.youtube.com/@TradingView
https://www.tradingview.com/
Platform capabilities
- Charts and tools for analysis. One of the main advantages of TradingView is the ability to build real-time charts using a variety of indicators and technical tools;
- Indicators and scripts. The platform offers built-in indicators such as MACD, RSI, Bollinger Bands, as well as thousands of custom solutions from the community;
- Creating your own trading ideas. You can develop strategies, test them on historical data and get signals for market entry;
- Community of traders. A unique feature of TradingView is its social functions. Here you can communicate with your colleagues, share ideas, view the ideas of other participants and even publish your own forecasts;
- Integration with brokers. The platform can be linked to your trading account for automatic transfer of trades;
- Training. A huge knowledge base, webinars and training materials will help you learn trading quickly.
How to register on TradingView?
Registering on the platform is easy and literally takes a couple minutes. Here are the step-by-step instructions:
- Go to the official TradingView website (tradingview.com);
- Click the “Register” button in the upper right corner of the screen;
- Fill out the form: enter your email, choose a password and select your country of residence;
- Confirm your registration by clicking on the link in the email that will arrive in your inbox.
TradingView provides four account options to choose from:
- Basic
- Essential
- Plus
- Premium
Let’s look at the rates and the difference between a paid subscription and a free account below.
A free account is suitable for beginners, which gives access to the following features:
- View graphs
- Three indicators on one chart
- Saving a single chart
- One template for indicators
- Creating one extended watch list
- Performing calculation of one indicator on the basis of another
Overview of TradingView interface
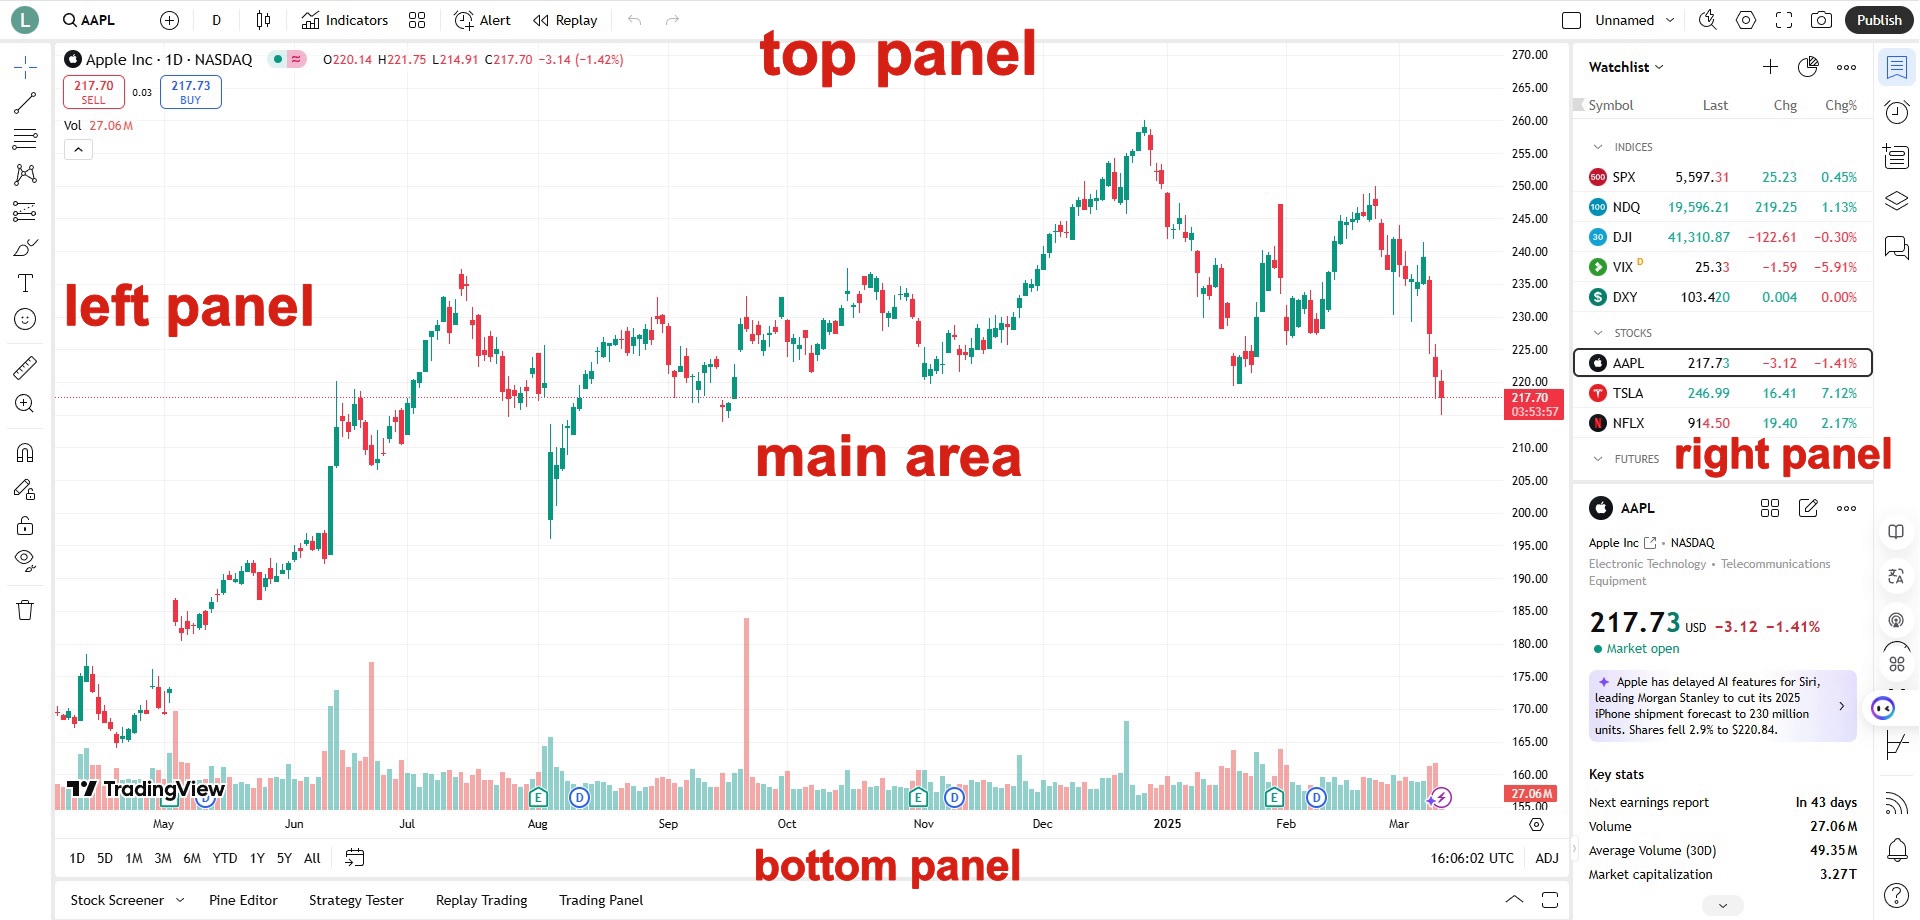
The interface of the platform is intuitive, but beginners may find it complicated. Let’s take a closer look at it.
Main area
This is the main space where charts are displayed and technical analyses are performed. You can select the desired asset, add indicators, draw trend lines and much more. The interface of the platform can be customized as you like. Right-click in the main area and select “Settings”. In the window that appears, you will be able to change the parameters you need.
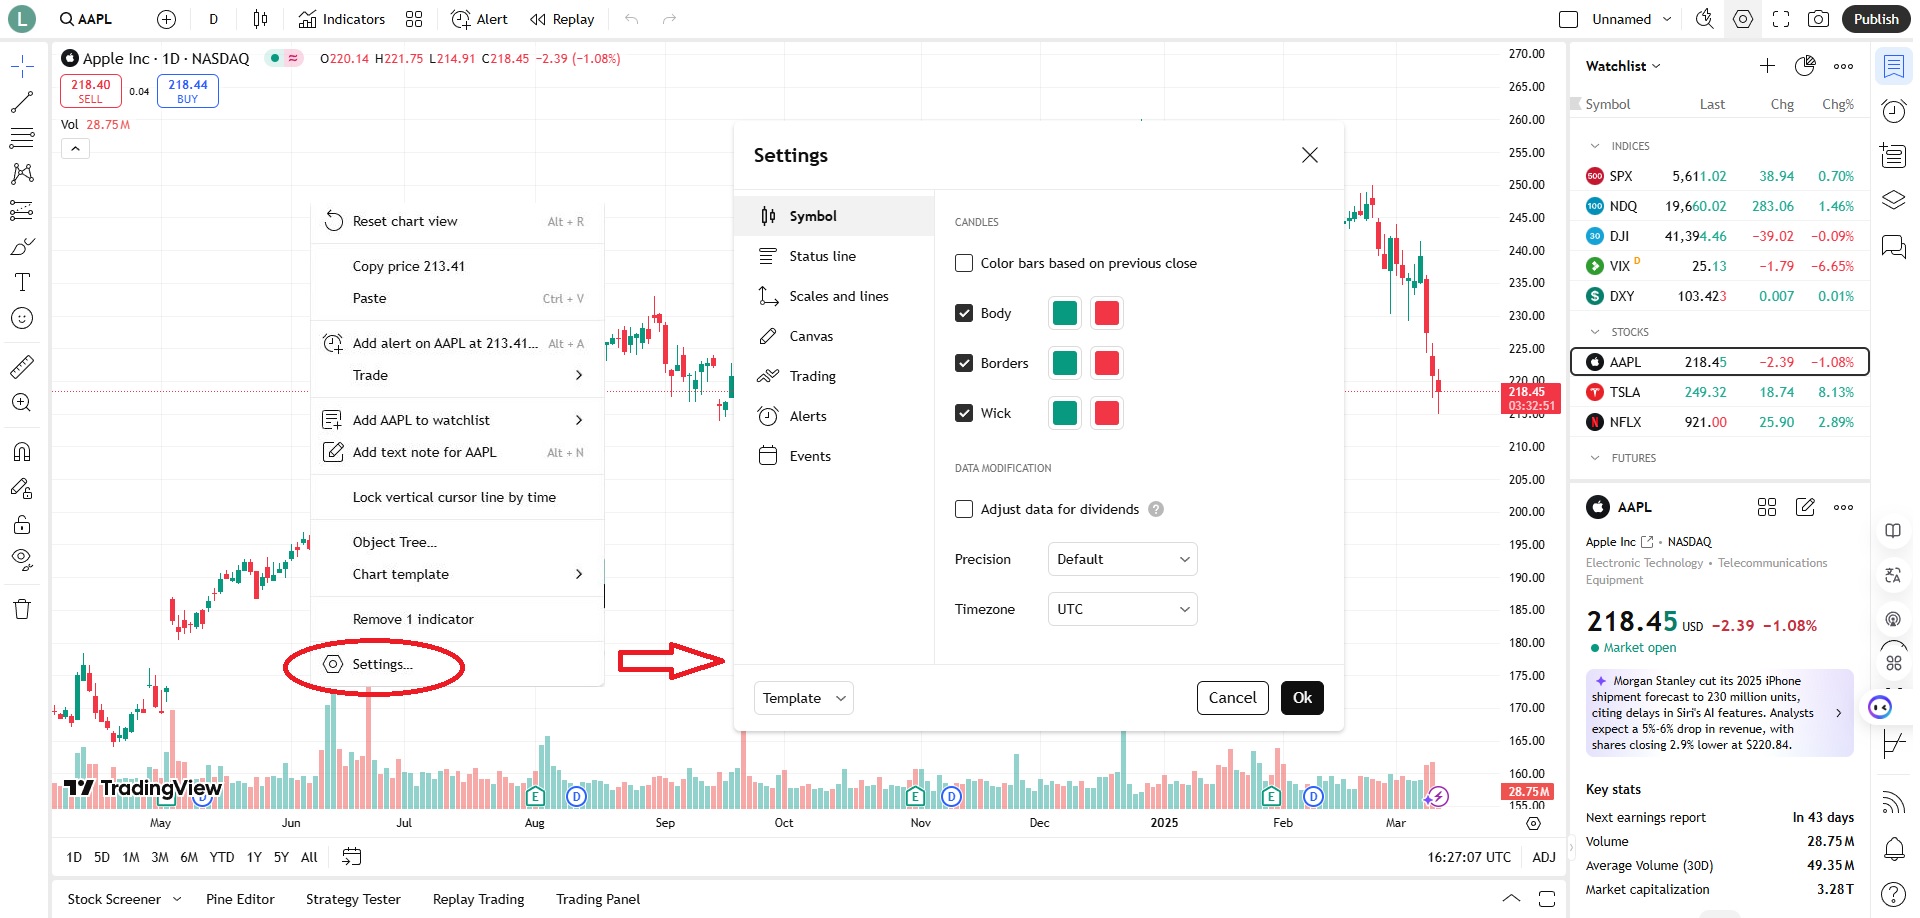
Here you can adjust the display of price lines, change the color scheme, switch from light theme to dark theme and so on. If you need to start over and remove all indicators and drawing tools from your chart, right-click in the main area of the chart and select “Remove all indicators” or “Remove all drawing tools”. This action will remove all items from your chart except candlesticks.
Top toolbar
Here you will find buttons to customize the chart, select a timeframe, change the chart style and add indicators.

- Timeframe: here you can select any timeframe you like. When you hover over the different timeframes, you will notice a star to the right. Clicking on it will add that timeframe to your favorites and it will appear at the top of the chart. This will allow you to quickly switch between different timeframes
- Candlesticks, bars: here you can set the format for displaying the charts. You can select standard options such as bars or candlesticks, as well as less common ones
- Indicators: this button gives access to the entire range of available indicators. On the right side there is a built-in list. It is enough to enter the indicator name and the system will suggest all suitable variants. You can simultaneously add several indicators to the chart
- Indicator template: with this button you can save the indicator set you have selected and quickly add the required indicators
- Create alerts: With this button you can customize notifications about changes in price, volume and other indicators, but you will have to manually set all the necessary parameters. It is easier and faster to right-click in the main chart window on the desired price level to create the required notification
- Bar Replay gives users the ability to replay past price movements to test the effectiveness of trading strategies. This tool allows traders to improve their approaches by analyzing historical market data and making trading decisions without the risk of financial losses
- Customize Layout: This button allows you to split the main window into several parts, which is convenient for comparing different trading instruments in one place. This function is available only to subscribers of paid tariffs
- Unnamed: saves all your chart settings. Any changes you make, including indicators, drawing tools and favorite elements, will remain committed. Moreover, your charts will be automatically saved even when you close the browser
- Quick search: search for drawings, functions and settings
- Chart settings: many different chart settings
- Full Screen Mode: puts the graph in full screen mode. To exit full screen mode, press Escape
- Take Snapshot: allows you to take a screenshot. Clicking this button instantly creates a URL link to an image of your graph that can be easily sent to other users
- Share: Post an idea, record a video, voice your opinion.
Right toolbar
The right panel has buttons for publishing posts, sharing ideas with the community, and viewing news.
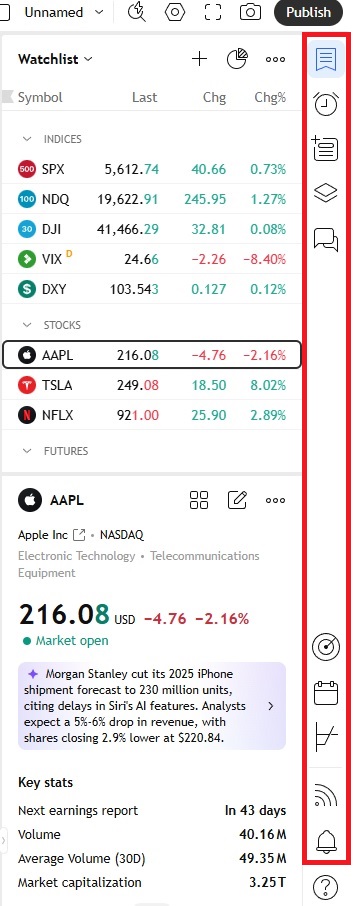
The most requested buttons:
- Watchlist: Button to view your list;
- Alerts: A list of your alerts;
- Data window: shows all data about the current trading instrument;
- Screeners: market leaders refers to the stock market and shows growth leaders;
- Calendar: all the important economic events for this week;
- My ideas: recording your ideas and making notes;
- Community feed: section represents the social functions of the platform;
- Help center: large database of answers to various questions.
Left toolbar
This panel contains a list of available tools for drawing on the chart, such as support/resistance lines, channels, Fibonacci figures and others.

- Your profile: here you can change your account settings;
- Cross: the cursor button allows you to select the pointer shape: point, arrow or crosshair;
- Trend line: line drawing tools include horizontal lines for levels, trend lines, vertical lines and parallel channels;
- Fib retracement: available tools include Fibonacci grids, Gann lines and Andrews pitchforks;
- XABCD pattern: harmonic patterns, graphical figures and Elliot waves;
- Long position: provides convenient tools for placing entry points, stop-losses and take-profits on the chart. This tool shows the number of pips in the levels and calculates the risk to profit ratio;
- Brush: shape drawing capability;
- Text: tool for adding text and visual comments;
- Icon: stickers, emoji and icons;
- Measure: a tool for measuring distances in points and time intervals;
- Zoom in: zoom button;
- Magnet mode: attracts objects to the nearest prices;
- Keep drawing: continuous drawing mode;
- Lock all drawings: all objects lock function;
- Hide all drawings: option to hide all drawn objects;
- Remove objects: to quickly remove drawing tools, indicators, or clear the entire chart
Bottom toolbar
This panel is used to manage indicators and chart settings. Here you can also change parameters of already installed indicators.

Time intervals
The panel starts with the selection of time intervals – a convenient way to quickly switch between different time segments of the chart. If you select the “All” option, the dynamics of the instrument for the entire available period will be displayed. Depending on your choice of interval, the time scale itself changes. This feature is useful for traders working with long timeframes to better track price changes over long time intervals.
Go button
Allows you to instantly jump to the desired date and time on the chart.
Time zone settings
You can change the time zone to the one you prefer. By default, it is automatically determined according to your geographical location.
Stock Screener: helps you find stocks that meet established financial or technical requirements, which is useful for both short-term trading and long-term investing.
The screener allows you to sort through thousands of stocks and generate an organized list for further action. It offers hundreds of ready-made filters based on fundamental and technical information.
Pine Editor:provides an opportunity to create unique indicators, scripts and trading signals for working on financial markets.
For example, you can use it to:
- to develop an indicator that will help to determine optimal moments for market entry;
- create an automated trading strategy capable of generating profits without user intervention.
Benefits of Pine Editor:
- Testing the developed strategies on historical data. This allows you to check their effectiveness before applying them to real markets;
- Possibility to publish your own developments on the TradingView platform. Other traders will be able to use the created indicators and strategies, and the author will receive income from subscriptions and donations;
- Free use. Pine Editor is available for traders of all levels – from beginners to professionals.
Strategy Tester: designed to evaluate the effectiveness of trading strategies by modeling them on historical data.
The main features of the tool are:
- Analyzing historical data. Users can analyze years of market data, allowing detailed testing of strategies in different market conditions and timeframes;
- Customizable Strategies. Traders can create and customize their strategies using the Pine Script programming language;
- Performance Metrics. Strategy Tester provides detailed reporting on key metrics such as net profit, success rate, maximum drawdown and risk-to-reward ratio;
- Trade Visualization. While testing the strategy, users can observe trades on the chart, tracking entry and exit points in real time;
- Optimization tools. Built-in optimization functions help automate the selection of strategy parameters for maximum efficiency;
- Exporting Results. Test results and performance reports can be easily exported for later analysis or record retention.
Replay Trading: allows you to test trading strategies by simulating past price changes.
Replay Trading functionality includes:
- Analyze past trades. You can look at what the chart looked like before you made a trade, which helps you evaluate it more objectively, eliminating emotional factors;
- Replay Settings. Using a spreadsheet with the dates of successful settings, you can repeat them many times using Replay Trading;
- Risk-free practice. Beginning traders can practice without the threat of real losses, which helps build confidence and experience before real trading operations;
- Speed Adjustment. The playback speed adapts to the individual learning rhythm, helping traders effectively master tools and strategies.
Trading Panel: this tool allows you to practice trading the assets whose charts you are viewing. Here you can select the “Paper Trading” mode – a demo account in TradingView. In addition, you can connect your account to one of the supported platforms to make real trades directly from TradingView.
TradingView tariffs
The platform offers several tariff plans, each with its own features. Here is a comparison of all tariffs for 2025:
| Basic | Essential | Plus | Premium | |
|---|---|---|---|---|
| Number of charts simultaneously | 1 | 2 | 4 | 8 |
| Indicators | Limited | 5 | 10 | 25 |
| Data export | No | Yes | Yes | Yes |
| Scripts | No | Limited | Yes | Yes |
| Social functions | Limited | Yes | Yes | Yes |
Difference between a paid subscription and a free account
A free account is ideal for getting started with the platform. However, if you want to access all TradingView features, it is worth considering paid subscriptions. They unlock additional features such as data export, unlimited indicators and scripts, and no ads.
How to use TradingView to create signals?
One of the key functions of TradingView is to create signals for trading. A signal is an automatic notification that the conditions for opening a trade have been met. To create a signal, follow the steps below:
- Open the chart of the required instrument;
- Add an indicator or script that will be used to generate a signal;
- Customize the parameters of the indicator or script;
- Save your settings and enable notifications.
Now, when the alarm goes off, you’ll receive a notification to your email or mobile device.
How to customize indicators on TradingView?
Setting indicators is an important stage in working with the platform. Each indicator has its own parameters that can be changed depending on your trading strategy. To customize the indicator:
- Select an instrument on the chart;
- Click on the “Add Indicator” icon in the top toolbar;
- Find the desired indicator in the list and add it to the chart;
- Click on the indicator name in the lower toolbar to open the settings window;
- Change the parameters of the indicator according to your strategy.
Bot integration using TradingView
TradingView allows you to integrate trading robots (bots) that automatically execute trades based on specified conditions. This is especially useful for those who want to automate their trading strategy. To integrate a bot:
- Create a script for your trading algorithm;
- Customize the parameters of the script;
- Enable trade automation through a broker that supports TradingView API.
TradingView social network
TradingView is not only an analytical platform, but also a full-fledged social network for traders. Here you can:
- Publish your ideas and predictions;
- Keep up to date with news and analysis;
- Communicate with other members of the community;
- Participate in contests and Challenges.
Social features make TradingView a unique platform for sharing experience and knowledge.
It should be borne in mind that operations on financial markets involve the risk of capital loss. Before making trading decisions, it is important to carefully analyze all the nuances and seek advice from a financial specialist.