In this article, we will break down all the main aspects of technical analysis, starting from its rules and ending with ways to automate trading.
- According to research, about 90% of professional traders use technical analysis in their work
- The first version of technical analysis appeared back in the 17th century in Japan and was called the candlestick method
- Technical analysis is applied not only to cryptocurrencies, but also to stocks, commodities and other financial instruments.
What is technical analysis?
Technical analysis is a method of predicting future movements in the price of an asset based on historical price and trading volume data. This tool is widely used by traders to make decisions on buying or selling stocks, commodities and, of course, cryptocurrencies.
Why do you need technical analysis?
The basic idea behind technical analysis is that history repeats itself. Traders believe that past price movements can suggest how price will behave in the future. Using charts and indicators, analysts try to identify trends and determine the best time to enter or exit a trade.
Three main rules of technical analysis
- Price takes everything into account: All the necessary information is already embedded in the price of an asset. This includes supply, demand, market participants’ expectations and even crowd psychology
- History repeats itself: Technical analysts believe that markets move according to certain patterns that repeat themselves over and over again. The trader’s job is to recognize these patterns and use them to their advantage
- Trends have power: Prices rarely move randomly. Instead, they form stable directions – trends. The trader’s main job is to follow the trend until it changes.
Basic tools of technical analysis
- Price Charts: Charts show the change in the price of an asset over time. The most popular are line charts, candlestick charts and bars
- Indicators: Indicators help to assess current market conditions and predict possible changes. Examples of popular indicators include Moving Average, Relative Strength Index (RSI) and MACD
- Support and Resistance Levels: These levels show areas where price is encountering resistance or support. They help identify potential trend reversal points.
Steps of technical analysis
- Data collection: Start by selecting the graph and time period you are interested in. The more data you have, the more accurate your analysis will be.
- Trend Analysis: Determine the direction of the current trend: uptrend, downtrend, or sideways. Trends can last from a few minutes to several months.
- Applying indicators: Choose the appropriate indicators and apply them to the chart. Watch the signals they generate.
- Identifying support and resistance levels: Find key levels where price has stopped or reversed in the past. These levels can serve as reference points for trading decisions.
- Formulating a trading strategy: Based on your analysis, develop a strategy for entering and exiting trades. Make sure the strategy fits your trading style and risk level.
Advantages and disadvantages of technical analysis
Advantages:
- Objectivity: Analysis is based on factual data, not emotion
- Versatility: Applicable to all types of assets
- Accessibility: Numerous free resources and software.
Disadvantages:
- Limited: Does not take into account external factors such as news and events
- Subjective interpretation: Different traders may see different signals on the same chart.
Examples of the use of technical analysis
Let’s consider an example of a simple trading signal based on the crossover of moving averages:
- Indicator setup: We use two moving averages – short (e.g. 50-period) and long (e.g. 200-period).
- Signal Interpretation: When the short average crosses the long one from bottom to top, it is considered a buy signal. A reverse crossover signals a possible sell.
How to use indicators
Indicators are special tools that help traders interpret price and volume data. They divide the market into parts that are easier to analyze. Here are some of the most popular indicators:
Moving Average
The moving average smooths out price fluctuations by showing the general direction of the trend. For example, if the price is above the 200-day MA, it indicates a strong uptrend.
Relative Strength Index (RSI)
RSI measures the speed and magnitude of price changes. Values below 30 indicate overbought, and values above 70 indicate oversold.
MACD (Moving Average Convergence/Divergence)
MACD shows the difference between two moving averages. When the MACD lines cross, it may indicate a trend change.
Types of graphs
Let’s consider the main types of charts in trading. Let’s take TradingView as an example – here you will find all popular charts.
Линейный график
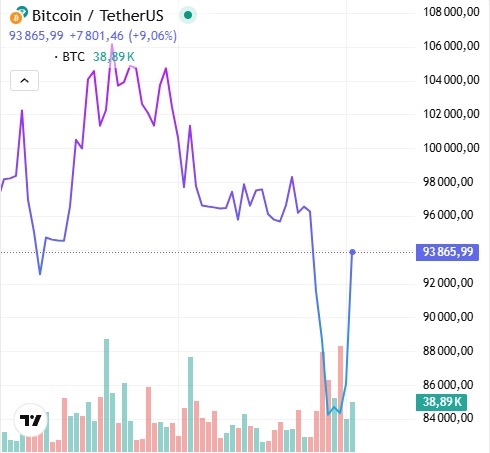
The simplest way to visualize the price. The line connects consecutive values of the closing price. Easy to perceive, but less detail.
Bars
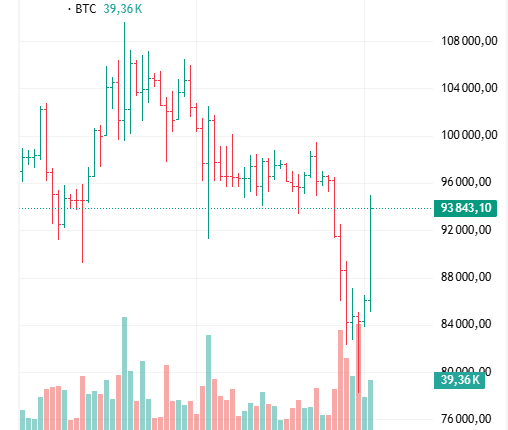
Each bar shows the opening, high, low and closing price for a specific period. Bar charts provide more information than line charts.
Candlestick Charts (Japanese Candlesticks)
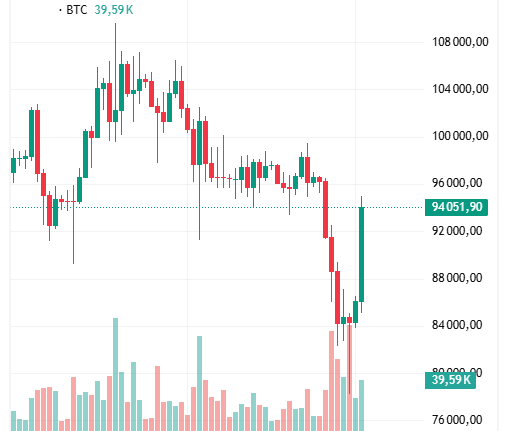
A candlestick chart is the most common type of chart.
Candlesticks consist of a body and shadows. The body reflects the range between the opening and closing prices, while the shadows represent the lows and highs. Candlestick charts are popular because of their wealth of information and ease of reading.
Patterns of technical analysis
Patterns are repetitive formations on charts that can predict further price movements. Let’s consider some classic examples:
Head and shoulders
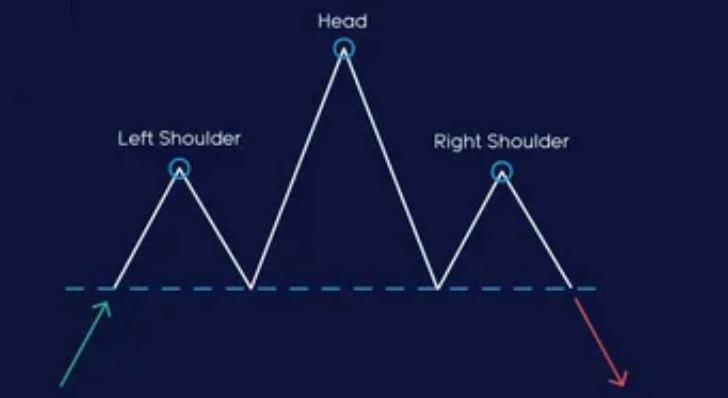
A formation with three peaks, where the middle peak is higher than the others. After the pattern is completed, a trend reversal is possible.
Double top/double bottom
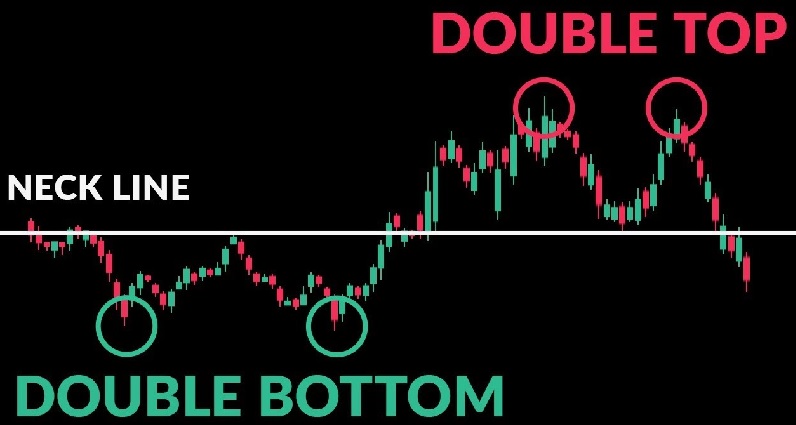
Two peaks/troughs at the same level. Indicates a possible end of the current trend.
Triangles
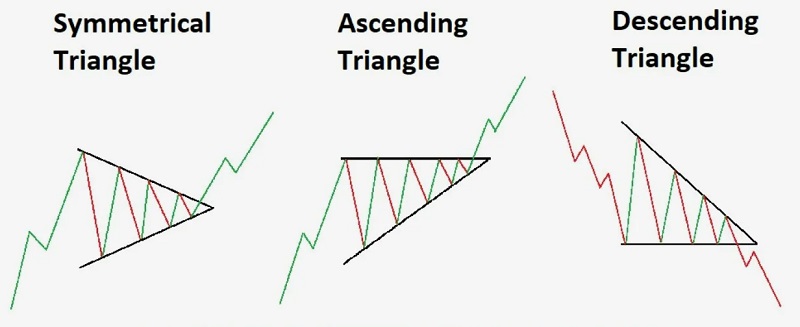
Consolidation of the price in a narrow range, after which there is a sharp breakout in the direction of the trend.
Trade automation using technical analysis
Trade automation allows you to set clear rules for entering and exiting positions, eliminating emotion and increasing efficiency. Here are some steps to get you started:
- Strategy Selection: Decide on the rules to be used for buying and selling
- Testing: Conduct backtesting on historical data to check the performance of the strategy
- Using trading robots: Set up software that will automatically execute your trading orders.
TradingView, the largest community of traders, is the leading resource for studying and analyzing cryptocurrency charts and indicators. The platform offers an extensive set of technical analysis tools, including candlesticks, lines and histograms, as well as the most popular indicators. Community users also analyze popular patterns and make predictions about future market movements. Any trader can share their ideas or study the opinions of experts in the field of cryptocurrency trading, whether it is technical analysis of bitcoin charts or explaining the dynamics of cryptocurrency markets.
Conclusion
Technical analysis is a powerful tool that helps traders find opportunities in the markets. It combines elements of math, psychology and experience. Having mastered its basics, you will be able to move forward confidently, using your knowledge to achieve success in cryptocurrency trading.